

Q4 2025 U.S. Freight Market Analysis and Forecast: Navigating the Fragile Balance and the Capacity Inflection Point

I. Executive Summary: The Transition from Correction to Rebalancing
The United States trucking industry is currently moving beyond the severe contraction phase experienced in 2023 and is firmly entrenched in an extended market correction cycle as of Q4 2025.This period is characterized by a gradual tightening of truckload capacity, driven primarily by the exit of non-sustainable operations rather than a massive surge in freight demand .While overall freight volumes remain soft, and growth in freight-intensive categories like construction and retail lags the broader, services-led GDP expansion , the sustained attrition of smaller carriers is establishing a structural floor under freight rates.
Analysts anticipate a fragile balance heading into the peak holiday season. Spot rates are forecast to achieve modest Year-over-Year (Y/Y) increases, projected to close Q4 with a total rise between +5% and +10%.This upward trajectory is fueled by normal seasonal factors and the ongoing reduction in available truck supply. A significant turning point occurred in August 2025, when the New Rate Differential (NRD)—comparing new contract rates to those they replaced—turned positive, indicating that deep contract rate erosion is largely concluded.
The most critical challenge for the Q4 and early Q1 2026 market is the divergence between carrier operational costs and shipper expectations for contract stability. Carriers continue to operate in a low-margin environment, absorbing elevated costs from high insurance premiums, financing rates, and newly imposed Section 232 tariffs on imported truck components taking effect November 1st.This relentless cost pressure contrasts sharply with shipper forecasts for only 2–4% contract rate increases in 2026 , setting the stage for increased tender rejections and amplified spot market volatility in early 2026.
II. Macroeconomic and Operating Environment Drivers
Economic Drivers Affecting Freight Demand (Q4 2025)
The U.S. economy maintains mixed momentum, with Real GDP for Q3 tracking at a moderate pace, sustained by public spending and services activity.However, private domestic demand has slowed to its weakest pace in over two years.
-
Retail and E-commerce Activity: The outlook for the 2025 holiday season is tempered by caution. Retailers are hesitant due to persistent inflation, with consumer prices still 25% above 2020 levels, straining affordability. Lingering low consumer sentiment and pressure in the labor market suggest restrained discretionary spending. Many retailers carried lean summer inventories and executed measured replenishment plans for Q4. This suggests that while there will be a typical seasonal surge in volume, it is unlikely to overwhelm the Dry Van sector or produce the service failures seen in past hyper-peaks.
-
Industrial and Construction Activity: Freight demand related to construction, manufacturing, and durable goods continues to lag broader economic activity. Flatbed demand, specifically, remains weak as construction activity slows down seasonally and industrial manufacturing shows limited recovery. Trade policy uncertainty, including ongoing tariff volatility, has prompted many businesses to delay major capital investments, further suppressing manufacturing-related freight movements.
Fuel Price Averages and Their Impact on Carrier Margins
Fuel costs provide a slight stabilizing factor for carrier budgets, though non-fuel inflation remains problematic.
-
Fuel Price Stability: The national average retail diesel price in late October 2025 was approximately $3.62 per gallon. This price is down 7 cents compared to one year prior. Forecasts from the EIA suggest relative stability, with prices expected to hover around the $3.40 to $3.50 range into the end of the year.
-
Margin Erosion: While stable diesel costs help normalize fuel surcharges and contain variable expenses, the overall financial pressure on carriers persists. The stabilization of fuel prices has not been enough to offset the relentless non-fuel cost inflation, particularly rising insurance premiums and the anticipation of higher equipment costs due to tariffs. Carriers remain in a low-margin environment, forcing them to prioritize asset efficiency and cost containment.
Driver Availability and Equipment Capacity Trends
The trucking market is undergoing a fundamental structural correction driven by supply attrition rather than demand recovery. This trend will define the market trajectory into 2026.
-
Capacity Attrition: The excess capacity that characterized the 2023–2024 market is rapidly draining as smaller, less-capitalized carriers exit operations. The financial barrier to entry for new carriers is critically high, with new operators facing costs nearly 20% higher than established fleets. This disparity is primarily due to inflated insurance premiums and the high financing costs associated with purchasing used trucks bought at peak pandemic valuations. Because fewer new carriers are replacing those that exit, truckload capacity structurally tightens.
-
Driver Pool Constraints: Driver availability remains a persistent issue. The Drug & Alcohol Clearinghouse has sidelined more than 180,000 drivers since its implementation in early 2020. Furthermore, the industry faces an aging workforce, with the average driver age hovering at 54 years old. Efforts by the federal government to enforce stricter English language proficiency requirements for non-U.S. citizens seeking Commercial Driver's Licenses (CDLs) are expected to place additional stress on the available driver pool.
-
Equipment Investment Restraint: Fleets are maintaining a highly cautious stance toward new investment. Class 8 net orders totaled only 20,666 units in September, significantly below replacement demand.1 Many fleets are extending their trade cycles to avoid elevated new truck prices and to hedge against regulatory uncertainty, such as the unresolved EPA 2027 low-NOx rule and the Section 232 tariffs on imported trucks and components set to begin November 1st. This collective restraint in purchasing guarantees that equipment capacity will not surge, reinforcing the supply-side floor under rates well into 2026.
III. Core Freight Segment Breakdown and Rate Forecast
The following data reflects the national average performance of key equipment types entering Q4 2025.

A. Dry Van Freight
The Dry Van sector, catering to retail, e-commerce, and general merchandise, exhibits the most significant structural tightening signals. The national average Load-to-Truck Ratio (LTR) for dry van is up an astounding 200% Y/Y , reflecting a 40% Y/Y increase in load posts and a 26% Y/Y decline in equipment posts in September.
-
Spot and Contract Rates: The 7-day national average spot rate in Week 43 (October 19–25) was approximately $2.08 per mile (including fuel surcharge). Excluding fuel, the September average was $1.63 per mile. Contract rates have been remarkably stagnant for over two years, hovering around $2.42 per mile (including fuel surcharge). The spot/contract spread remains wide, favoring shippers.
-
Forecast Trends (Next 60 Days): Spot rate momentum, which received a temporary lift from early "pre-tariff" shipping activity in September, is expected to moderate post-October. However, sustained capacity exit combined with Thanksgiving and early December restocking pushes will maintain upward pressure, with rates expected to stabilize at or slightly above current levels. Shippers retain control of most contract negotiations, limiting projected 2026 increases to 2–4%.
B. Refrigerated (Reefer) Freight
The Reefer market is defined by acute volatility, registering a national average spot rate of $2.47 per mile in Week 43.The Reefer LTR is up 118.6% Y/Y, indicating strong demand coupled with reduced truck availability.
-
Q4 Volatility and Seasonal Demand: Demand is driven by predictable seasonal cycles: the transition of leafy green crops from Salinas to Yuma, heavy volumes of cross-border imports (especially through Texas), and holiday commodity surges for poultry, sweet potatoes, and root crops (potatoes, apples, onions). Additionally, Q4 marks the beginning of "protect from freeze" requirements, which limit operational flexibility in the Midwest and Northeast.
-
Policy-Driven Squeeze: The most dramatic rate movements are occurring in specific regional corridors impacted by policy changes. Enhanced policy enforcement, including immigration status and English Language Proficiency (ELP) assessments at scale houses in Florida and Texas, has dramatically constrained capacity in certain markets. In Lakeland, Florida, reefer load posts surged 28% week-over-week, pushing outbound spot reefer rates up 10 cents per mile. Similarly, outbound McAllen, Texas, reefer spot rates jumped 7 cents, reaching $2.03 per mile (linehaul only), representing nearly an $800 increase per load Y/Y on the 1,600-mile run to Los Angeles. This demonstrates that enforcement activity, outside of traditional economic indicators, is now a primary spot rate mover in perishable lanes.
-
Carrier Profitability Outlook: Reefer carriers that can navigate the compliance constraints in Texas and Florida are currently capturing substantial temporary risk premiums, resulting in superior profitability in these high-demand markets.
C. Flatbed Freight
Flatbed spot rates remained unchanged in Week 43 at a national average of $2.44 per mile. The sector’s LTR is up 144% Y/Y , indicating less available capacity, but underlying demand remains generally soft.
-
Demand Drivers: Demand related to general construction is slowing due to seasonal weather and reduced broader economic activity. However, specialized freight related to the energy sector and high-tech infrastructure spending offers critical support. The Global Oilfield Equipment Market is estimated to be valued at $134.65 billion in 2025, providing consistent, heavy-haul demand in key oil and gas corridors like Texas.
-
Capacity Outlook: Capacity is expected to loosen further through November and December as construction projects slow in northern latitudes. Rate pressure is likely to be delayed until early Q1 2026 when infrastructure projects resume post-winter.
D. End Dump and Hazmat Freight
-
End Dump Freight: End Dump movements, which typically involve aggregates, grain, fertilizer, and bulk commodities, follow infrastructure and agricultural timelines. Q4 marks a transition from peak construction-related hauling to agricultural movements, particularly grain and fertilizer positioning before winter. Regional volatility will increase, especially in the Central Plains, depending on the harvest pace and early winter weather patterns.
-
Hazmat Freight: This specialized sector offers notable stability due to the high regulatory barriers to entry. The Hazmat Trucking Service market in North America is robust and projects strong growth, estimated to reach $350 million by 2025 with an anticipated Compound Annual Growth Rate (CAGR) of 7.5% through 2033. Demand is steady, fueled by the continuous need for chemical distribution and fuel hauling. Carriers in this segment benefit from compliance-driven pricing, leading to inherently higher profitability compared to the volatile dry van market.
IV. Spot vs. Contract Freight Comparison and Regional Analysis
The Growing Contract/Spot Tension
The freight market is characterized by a significant tension between the stagnant contract environment and the accelerating spot market correction. The New Rate Differential (NRD) turning positive in August confirms that the market has established a floor for contractual pricing. This structural shift indicates that shippers should no longer expect large, systemic rate reductions in their upcoming RFPs.
Shipper control over contract negotiations is currently maintained by soft freight volumes and residual private fleet capacity.5 However, the projected contract rate increases of 2–4% planned by most shippers for 2026 are widely insufficient to cover carrier operating cost increases stemming from persistent insurance costs, equipment financing, and new tariffs. When the spot market closes Q4 at a 5–10% Y/Y increase , the spread between contract and spot rates will narrow significantly. This shrinking differential, coupled with low margins, increases the financial incentive for carriers to reject tendered contract loads in favor of higher-paying spot freight. This trend is projected to manifest as higher tender rejection indices for contract freight in late Q4 2025 and throughout Q1 2026, forcing shippers to face unexpected spot-rate exposure.
Regional Hot and Cold Markets (Q4 2025)
Regional divergence is a defining characteristic of Q4, emphasizing the impact of localized constraints and policy enforcement.
-
"Hot" Markets (Capacity Tightness and Rate Leverage):
-
Texas Corridor (Reefer and Flatbed): McAllen is critically tight for reefer capacity due to heightened enforcement and surging cross-border import volumes. Houston remains a tight market for specialized Flatbed movements serving the oilfield equipment sector.
-
Midwest States: The 13 key Midwest states, representing 46% of national load volume, are serving as the national rate barometer. The average linehaul Dry Van rate in this region is 23 cents above the national 7-day rolling average. This regional strength signals future national rate stability and subsequent upward movement.
-
Southeast (Reefer): Florida markets like Lakeland are experiencing artificial capacity constraints due to enforcement actions at scale houses, leading to immediate spot rate spikes and increased difficulty in securing coverage.
-
West Coast (Dry Van): Strong Load-to-Truck Ratios in the West Coast indicate that e-commerce and retail replenishment activity, combined with localized capacity attrition, is supporting above-average rates.
-
-
"Cold" Markets (Loose Capacity/Stagnant Rates):
-
Markets heavily reliant on general construction and industrial manufacturing that have not benefited from energy sector demand or specific infrastructure project flows. Flatbed capacity remains generally looser in Northern and Mid-Atlantic states as seasonal weather curtailments begin.
-
V. Load-Board and Data Insights
Trailer Type Load-to-Truck Ratio Comparison
The Load-to-Truck Ratio (LTR) is the most reliable real-time indicator of the balance between demand (load posts) and supply (truck posts) in the spot market. The data clearly illustrates the severity of supply-side correction across all segments compared to the prior year:
-
Dry Van LTR: Up 200% Y/Y.
-
Flatbed LTR: Up 144% Y/Y.
-
Reefer LTR: Up 118% Y/Y.
The massive increase in the Dry Van LTR is particularly significant. While Reefer capacity is critically constrained in regional hotspots (FL, TX), the Dry Van segment is witnessing the most extreme structural tightening relative to its historical capacity, confirming that the market correction is widespread and foundational.
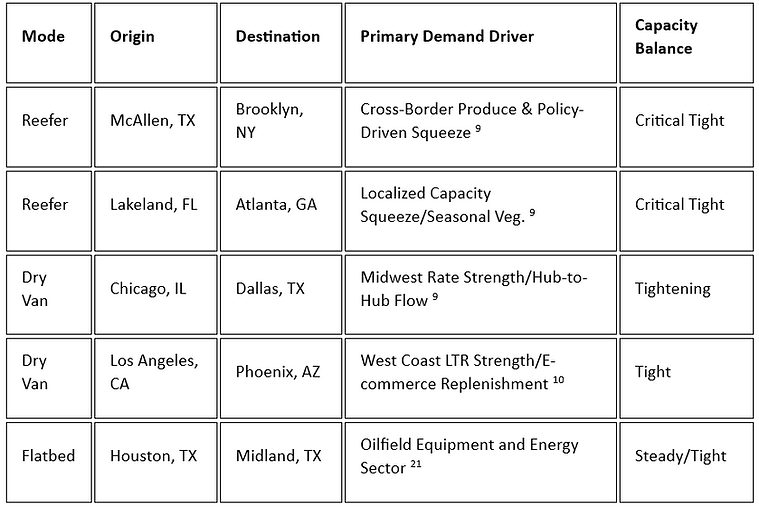
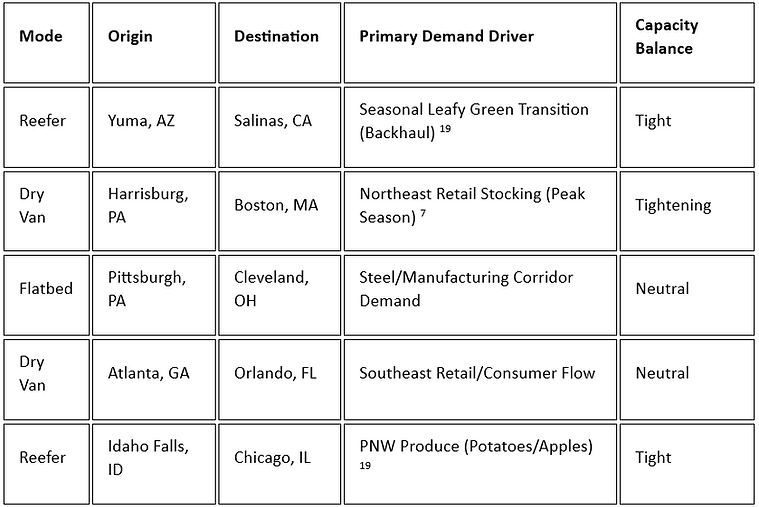
High-Demand Lane Summary
Strategic truck positioning must target regional convergence points where high demand meets constrained capacity due to seasonality, policy enforcement, or manufacturing hubs.
Table 2: Top 10 High-Demand Lanes by Trailer Type (Forecast Oct/Nov 2025)
VI. Policy and Compliance Outlook
Regulatory certainty and compliance burdens continue to influence carrier operating costs and availability into early 2026.
-
FMCSA Regulatory Changes: The Federal Motor Carrier Safety Administration (FMCSA) has re-issued a temporary waiver permitting CDL and Commercial Learner’s Permit (CLP) holders to use a paper copy of the medical examiner's certificate for up to 60 days. This waiver is effective from October , 2025, through January, 2026. However, several significant regulatory updates remain delayed. Changes to the Unified Registration System (URS) are now scheduled for March 2026, and rulemaking concerning the Property Broker Transparency Rule has been delayed until May 2026. The continued delay of the transparency rule contributes to information asymmetry, complicating carrier negotiations.
-
HOS, ELD, and Compliance: The deadline for the ELD mandate extension for pre-2000 engines passed in June 2025. All commercial trucks are now required to utilize compliant Electronic Logging Devices, regardless of engine age. While federal Hours-of-Service (HOS) rules remain stable, localized enforcement actions, particularly those tied to policy compliance at state scalehouses in high-volume regions like Florida and Texas, have immediate, profound effects on regional capacity and efficiency.
-
Insurance Cost Trends: High insurance costs remain a primary barrier to entry and a structural impediment to profitability for new and small carriers. While global commercial insurance rates have shown modest easing for well-managed risks, capacity for high liability limits remains constrained. This persistent cost pressure ensures that operating expenses will continue to climb for most fleets in Q1 2026, widening the gap between revenue expectations and actual operational expenditures.
VII. Strategic Recommendations for 2026 Preparedness
Guidance for Carriers
Carriers must shift their strategy from survival to capitalizing on capacity scarcity. Positioning and rate discipline are paramount.
-
Exploit Regional Rate Spikes: Carriers operating Dry Van assets should prioritize lanes originating in the 13 key Midwest states to capture above-average linehaul rates. Reefer carriers must strategically navigate the policy-constrained markets of Texas (McAllen) and Florida (Lakeland) to capture significant temporary risk premiums offered by shippers desperate for coverage.
-
Demand Cost-Plus Contracts: Utilize the positive New Rate Differential (NRD) and explicit cost inflation data (tariffs, insurance) to push back aggressively on 2026 contract renewals. Carriers must negotiate rate increases significantly higher than the 2–4% budgeted by shippers to cover elevated operational costs.
-
Prioritize Asset Utilization: Given the high cost of new equipment and financing, fleets should continue to extend trade cycles and focus intensely on asset efficiency and preventative maintenance rather than large-scale fleet expansion.
Guidance for Brokers & Shippers
Shippers must accept that the period of historically cheap freight is over and adjust procurement strategies accordingly to ensure service reliability.
-
Secure Critical Reefer Coverage Immediately: Due to converging seasonal spikes and policy-induced constraints, particularly in the Texas border and Southeast agricultural corridors, shippers with temperature-sensitive freight should lock in coverage immediately to mitigate extreme spot market exposure in November.
-
Mitigate Tender Rejection Risk: Shippers must recognize that low-balling contract renewals (2–4% planned increases) will inevitably lead to increased tender rejection rates in Q1 2026 as capacity continues to exit. Budgeting for higher spot exposure or offering more competitive contract terms now is necessary to protect supply chain reliability.
-
Formalize Winter Preparation: Proactively engage partners to finalize "protect from freeze" procedures for all temperature-sensitive goods—not just perishables—moving through the Northeast and upper Midwest, typically from October through March.7
Investor Insight: Decoding Freight Investment
The current market represents the bottoming phase of the cycle, where structural cleanup occurs. Investment decisions should prioritize capacity quality and resilience over short-term yield.
-
The Investment Thesis: The long-term viability of the trucking sector is improving as non-sustainable, low-cost capacity is purged from the market. The rate recovery is fundamentally driven by supply reduction (attrition), which is a stronger indicator of sustained rate growth than a volatile demand spike.
-
Risk Factors: The primary risk remains asset replacement cost. The confluence of high financing rates and trade policy uncertainty (tariffs on components) will suppress Class 8 purchases well into 2026.1
-
Strategic Focus: Investors should favor established, well-capitalized fleets with robust operating ratios, proven asset lifecycle extension strategies, and exposure to high-margin, specialized segments (e.g., Hazmat and specialized Flatbed) that are insulated from general retail softness. Avoid investment in new, small operations that cannot overcome the soaring insurance and entry cost barriers.
VIII. Key Takeaways for Carriers & Brokers
-
Capacity Attrition is the Primary Driver: The market's structural floor has been established by the sustained exit of carriers and prohibitively high entry costs for new entrants. Expect a gradual, structural rate recovery, not a sudden volume shock.
-
Reefer Markets are Policy Hotspots: Enhanced policy enforcement in Florida and Texas is severely constricting refrigerated capacity, creating acute rate leverage for compliant carriers in those corridors through November.
-
Midwest Signals Recovery: Dry Van rates in the Midwest are significantly outpacing the national average, indicating that this region will be the bellwether for sustained rate strength leading into Q1 2026.9
-
Contract Risk is High for Shippers: Stagnant 2026 contract renewal expectations (2–4% increases) are insufficient to cover carrier costs, guaranteeing a subsequent rise in tender rejections and higher, unexpected spot exposure in Q1.
-
Manage Tariff Costs: Carriers must anticipate cost pass-through from the Section 232 tariffs on truck components starting November 1st. This will stress equipment maintenance and replacement budgets, forcing fleets to be highly disciplined about utilization and efficiency.